How to Create a GUI in Python using tkinter
In this tutorial you will create a graphical user interface (GUI) that generates charts from numerical user inputs.
TLDR
The following code block gives you the entire script for creating an example GUI. See the subsequent sections for a step-by-step guide with detailed explanations.
import tkinter as tk
from matplotlib.backends.backend_tkagg import FigureCanvasTkAgg
from matplotlib.figure import Figure

root = tk.Tk()
root.geometry("900x500")

canvas = tk.Canvas(root, width=800, height=400)
canvas.pack()

header = tk.Label(root, text="Number of caught fish")
header.config(font=("Arial", 18),)
canvas.create_window(400, 40, window=header)

entry1_label = tk.Label(root, text="pufferfish")
canvas.create_window(280, 90, anchor="w", window=entry1_label)
entry1 = tk.Entry(root)
canvas.create_window(450, 90, window=entry1)

entry2_label = tk.Label(root, text="salmon")
canvas.create_window(280, 120, anchor="w", window=entry2_label)
entry2 = tk.Entry(root)
canvas.create_window(450, 120, window=entry2)

entry3_label = tk.Label(root, text="shark")
canvas.create_window(280, 150, anchor="w", window=entry3_label)
entry3 = tk.Entry(root)
canvas.create_window(450, 150, window=entry3)

def create_charts():
    x1 = float(entry1.get())
    x2 = float(entry2.get())
    x3 = float(entry3.get())

    figure1 = Figure(figsize=(4, 3), dpi=100)
    subplot1 = figure1.add_subplot(111)
    x_axis = [float(x1), float(x2), float(x3)]
    y_axis = [float(x1), float(x2), float(x3)]
    subplot1.bar(x_axis, y_axis, color="lightsteelblue")
    bar1 = FigureCanvasTkAgg(figure1, root)
    bar1.get_tk_widget().place(x=50, y=195)

    figure2 = Figure(figsize=(4, 3), dpi=100)
    subplot2 = figure2.add_subplot(111)
    labels2 = ["pufferfish", "salmon", "shark"]
    pie_sizes = [float(x1), float(x2), float(x3)]
    my_colors2 = ["lightblue", "lightsteelblue", "silver"]
    subplot2.pie(
        pie_sizes,
        colors=my_colors2,
        labels=labels2,
        autopct='%1.1f%%',
        startangle=90,
    )
    subplot2.axis("equal")
    pie2 = FigureCanvasTkAgg(figure2, root)
    pie2.get_tk_widget().place(x=450, y=195)


button = tk.Button(
    root,
    text="Create charts",
    fg="blue",
    command=create_charts,
    font=("Arial", 10, "bold"),
)
canvas.create_window(450, 180, window=button)

root.mainloop()
Prerequisites
You will need matplotlib and tkinter to follow this tutorial.
Install matplotlib
To install matplotlib run:
pip install matplotlib
Install tkinter
tkinter comes with Python. If it is not installed on your system, follow these steps:
Windows:
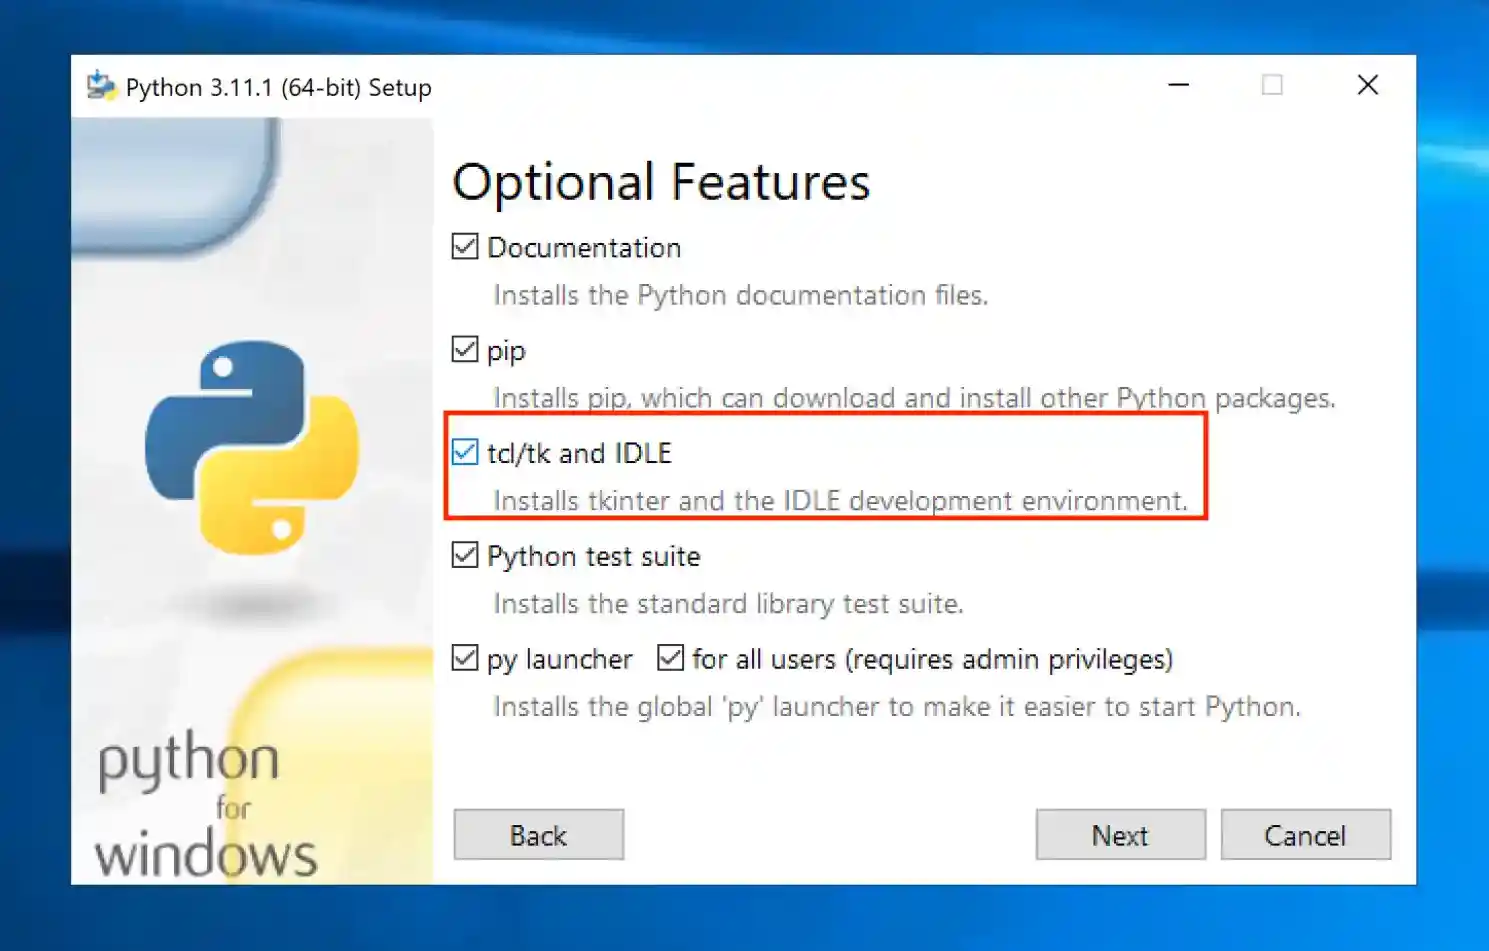
Reinstall and customize Python.
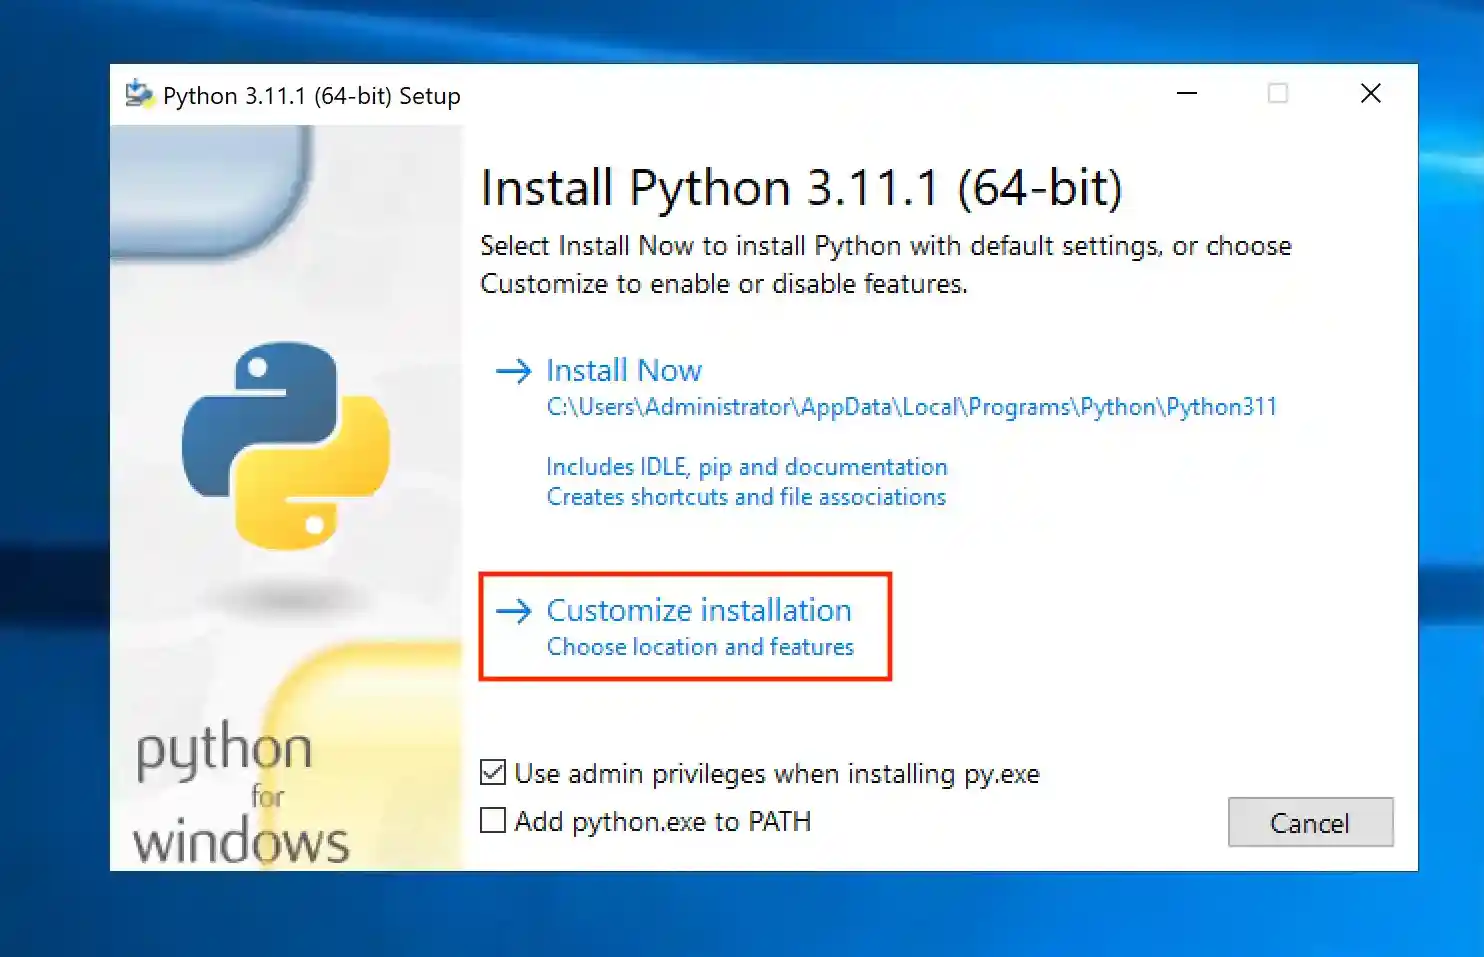
Make sure that the checkmark for tcl/tk is set:
MacOS:
Run the following command to install tkinter:
brew install tcl-tk
Similarly, on Linux run:
pip install python3-tk
Step-by-Step Example
Let's create a graphical interface that (i) let's a user input the number of caught fish and (ii) creates charts from those inputs. The following will walk you through all steps component by component.
The Root Window and the Canvas
Before you can place elements such as entry boxes, labels and buttons, you will need to create a root window and a canvas. The following code creates both:
import tkinter as tk

root = tk.Tk()
# give the window a 900x500 dimension
root.geometry("900x500")

canvas = tk.Canvas(root, width=800, height=400)
canvas.pack()

# code that creates objects inside the root window goes here

root.mainloop()
The Labels
Add a header to the interface to let the user know what it is about:
header = tk.Label(root, text="Number of caught fish")
header.config(font=("Arial", 18),)
canvas.create_window(400, 40, window=header)
The Entry Boxes
Next, place three entry boxes (input fields) on the canvas. Don't forget to add appropriate labels.
entry1_label = tk.Label(root, text="pufferfish")
canvas.create_window(280, 90, anchor="w", window=entry1_label)
entry1 = tk.Entry(root)
canvas.create_window(450, 90, window=entry1)

entry2_label = tk.Label(root, text="salmon")
canvas.create_window(280, 120, anchor="w", window=entry2_label)
entry2 = tk.Entry(root)
canvas.create_window(450, 120, window=entry2)

entry3_label = tk.Label(root, text="shark")
canvas.create_window(280, 150, anchor="w", window=entry3_label)
entry3 = tk.Entry(root)
canvas.create_window(450, 150, window=entry3)
The Function
Let's create a function that creates charts (a bar chart and a pie chart) from the inputs of the above entry boxes.
def create_charts():
    x1 = float(entry1.get())
    x2 = float(entry2.get())
    x3 = float(entry3.get())

    figure1 = Figure(figsize=(4, 3), dpi=100)
    subplot1 = figure1.add_subplot(111)
    x_axis = [float(x1), float(x2), float(x3)]
    y_axis = [float(x1), float(x2), float(x3)]
    subplot1.bar(x_axis, y_axis, color="lightsteelblue")
    bar1 = FigureCanvasTkAgg(figure1, root)
    bar1.get_tk_widget().place(x=50, y=195)

    figure2 = Figure(figsize=(4, 3), dpi=100)
    subplot2 = figure2.add_subplot(111)
    labels2 = ["pufferfish", "salmon", "shark"]
    pie_sizes = [float(x1), float(x2), float(x3)]
    my_colors2 = ["lightblue", "lightsteelblue", "silver"]
    subplot2.pie(
        pie_sizes,
        colors=my_colors2,
        labels=labels2,
        autopct='%1.1f%%',
        startangle=90,
    )
    subplot2.axis("equal")
    pie2 = FigureCanvasTkAgg(figure2, root)
    pie2.get_tk_widget().place(x=450, y=195)
The Button
Finally, create a button that triggers the create_chart function.
button = tk.Button(
    root,
    text="Create charts",
    fg="blue",
    command=create_charts,
    font=("Arial", 10, "bold"),
)
canvas.create_window(450, 180, window=button)
Launch the GUI
Let's launch the GUI:
python create_charts_gui.py
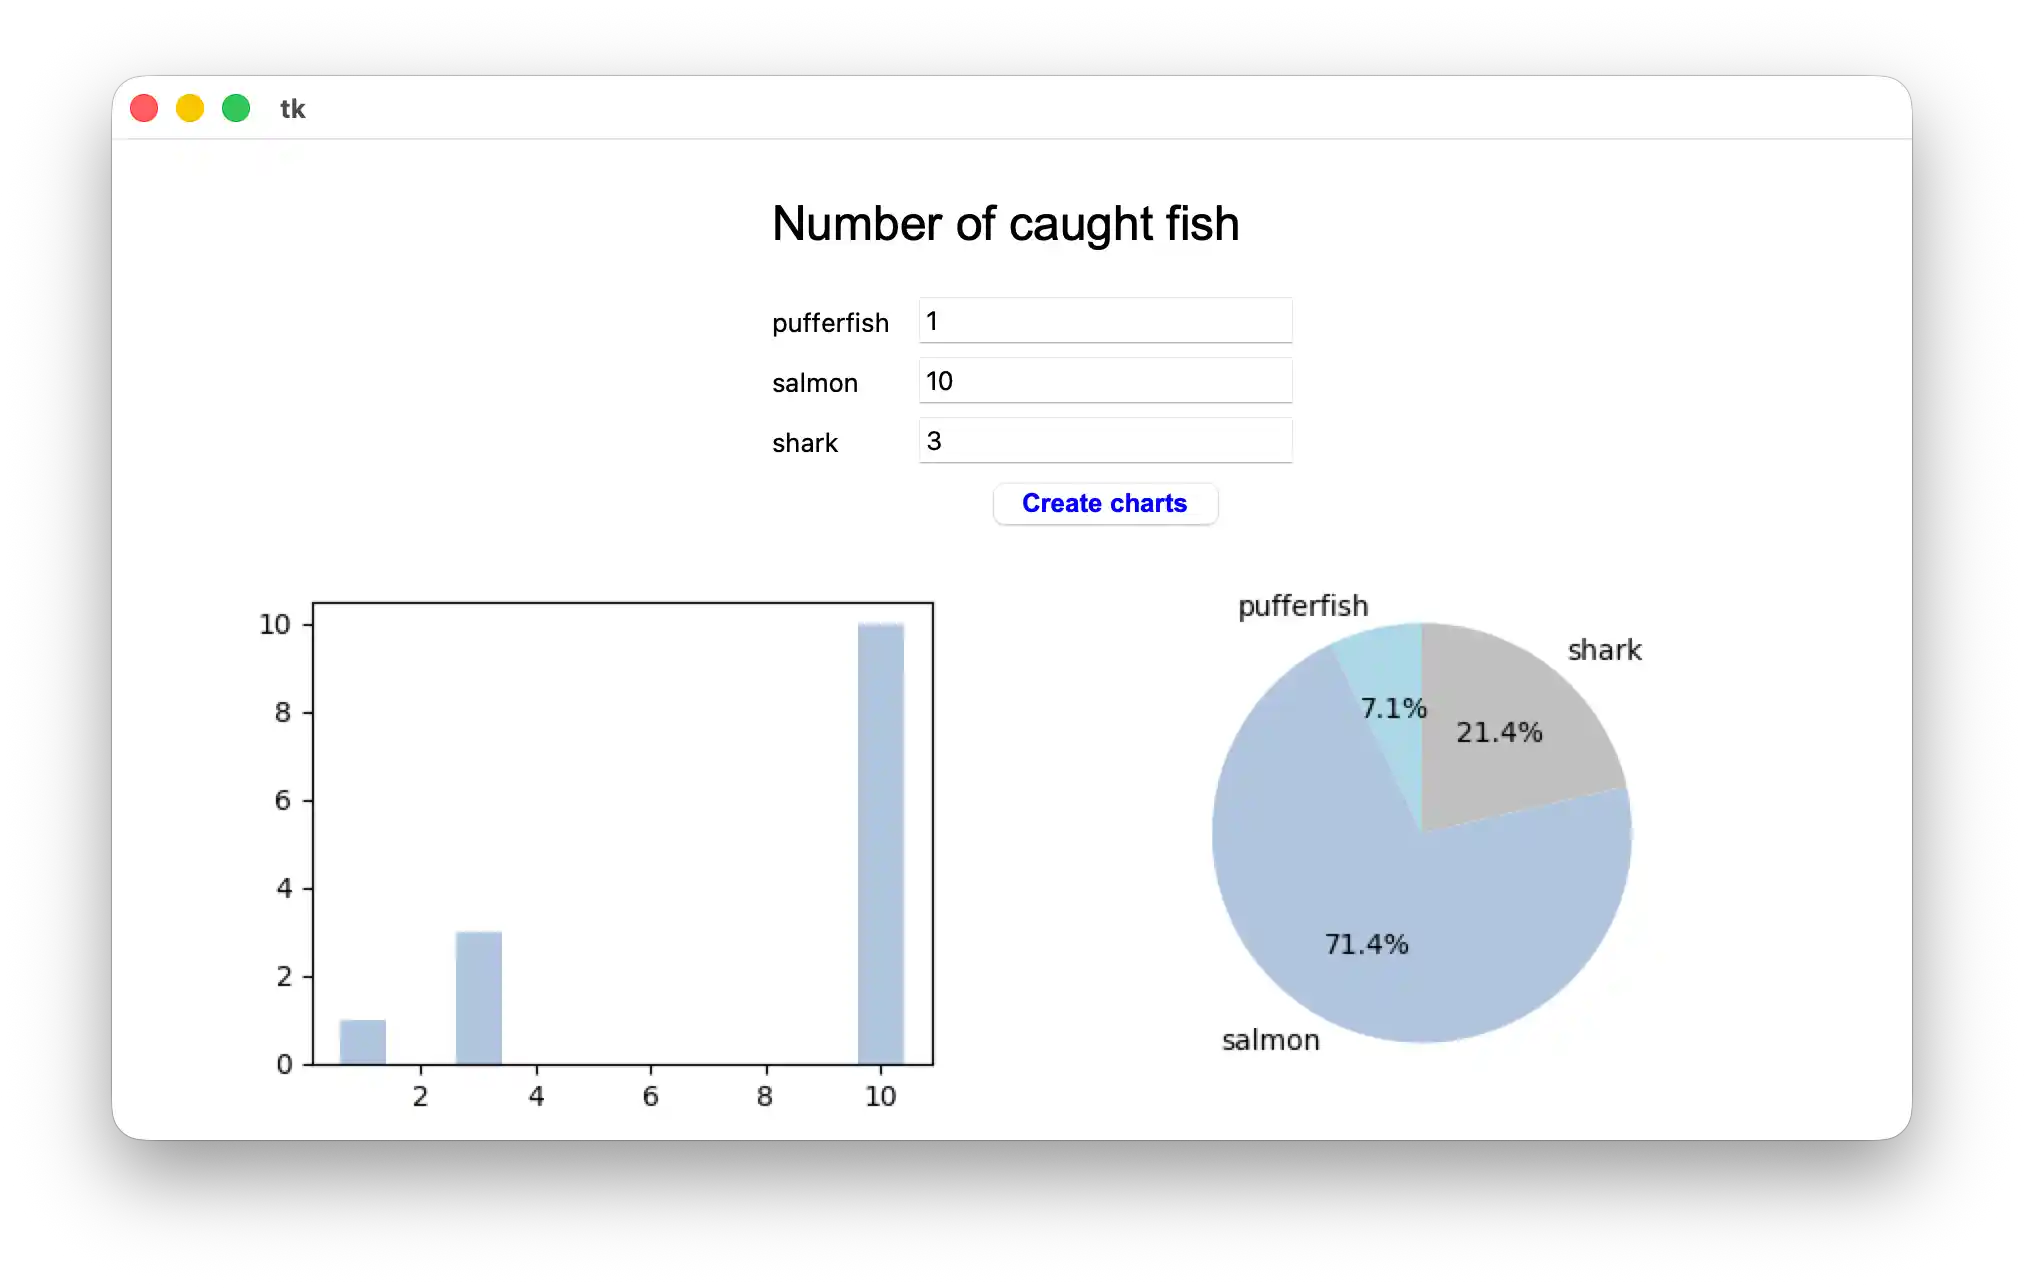
A window should pop up. Test your GUI by inputing numbers in the three input boxes and clicking on the create chart button. You should see something like this:
Conclusion
That's it! You just created your first graphical user interface in Python.