How to Create a Covariance Matrix in Python
In this tutorial, you will learn two ways to create a covariance matrix in Python.
TLDR solution
import numpy as np

observations_a = [a1, a2, a3, ...]
observations_b = [b1, b2, b3, ...]
observations_c = [c1, c2, c3, ...]

data = np.array([observations_a, observations_b, observations_c])

cov_matrix = np.cov(data)
import pandas as pd

data =  {'observations_a': [a1, a2, a3, ...],
        'observations_b': [b1, b2, b3, ...],
        'observations_c': [c1, c2, c3, ...]
        }

df = pd.DataFrame(data)

cov_matrix = pd.DataFrame.cov(df)
Method 1: Calculating the Covariance Matrix using NumPy
If you don't have NumPy already installed, execute the following command in your terminal:
pip install numpy
Let's say, you have the following sampled data on fish populations:
| salmon | pufferfish | shark |
|---|---|---|
| 125 | 59 | 5 |
| 102 | 48 | 8 |
| 86 | 55 | 9 |
| 92 | 46 | 11 |
| 109 | 51 | 6 |
You can then compute the covariance matrix as follows:
import numpy as np

salmon = [125, 102, 86, 92, 109]
pufferfish = [59, 48, 55, 46, 51]
shark = [5, 8, 9, 11, 6]

data = np.array([salmon, pufferfish, shark])

cov_matrix = np.cov(data)

print(cov_matrix)
Note that, by default, np.cov() handles the normalization of your data (N-1) for you.
You should get the following output:
[[232.7   41.7  -32.05]
 [ 41.7   27.7   -8.55]
 [-32.05  -8.55   5.7 ]]
Method 2: Calculating the Covariance Matrix using pandas
If you don't have pandas already installed, execute the following command in your terminal:
pip install pandas
Let's use the same data as above. You can the compute the covariance matrix using pandas as follows:
import pandas as pd

data =  {'salmon' : [125, 102, 86, 92, 109],
        'pufferfish' : [59, 48, 55, 46, 51],
        'shark' : [5, 8, 9, 11, 6]
        }

df = pd.DataFrame(data)

cov_matrix = pd.DataFrame.cov(df)

print(cov_matrix)
You should get the same matrix as derived by NumPy:
            salmon  pufferfish  shark
salmon      232.70       41.70 -32.05
pufferfish   41.70       27.70  -8.55
shark       -32.05       -8.55   5.70
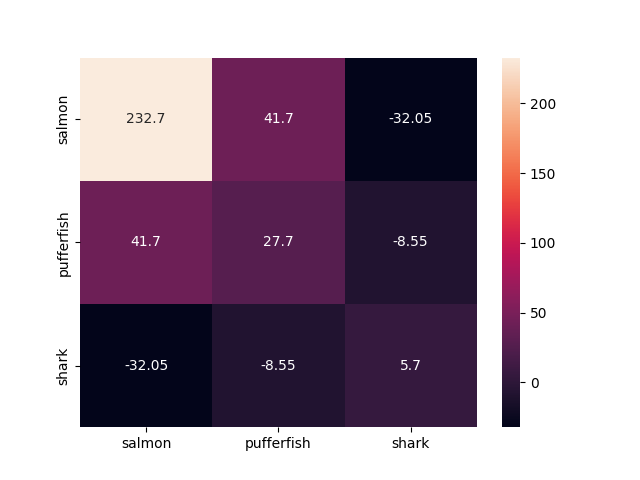
Moreover, you can use Matplotlib/seaborn to visualize the pandas covariance matrix as heatmap:
import matplotlib.pyplot as plt
import seaborn as sn

cov_matrix = pd.DataFrame.cov(df)
sn.heatmap(cov_matrix, annot=True, fmt='g')
plt.show()
Here is the resulting heatmap:
That's it! You just learned how to compute a covariance matrix in Python.